
Table 1.
Baseline Characteristics of MCI Study Sample
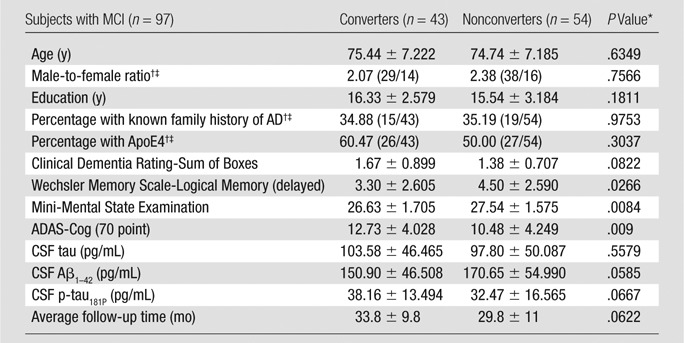
Note.—Unless otherwise indicated, data are means ± standard deviations.
*
Unless otherwise indicated, P values were obtained by performing t tests.
†
Data in parentheses are numbers of patients.
‡
P values obtained by performing Χ2 tests.