
Figure 2.
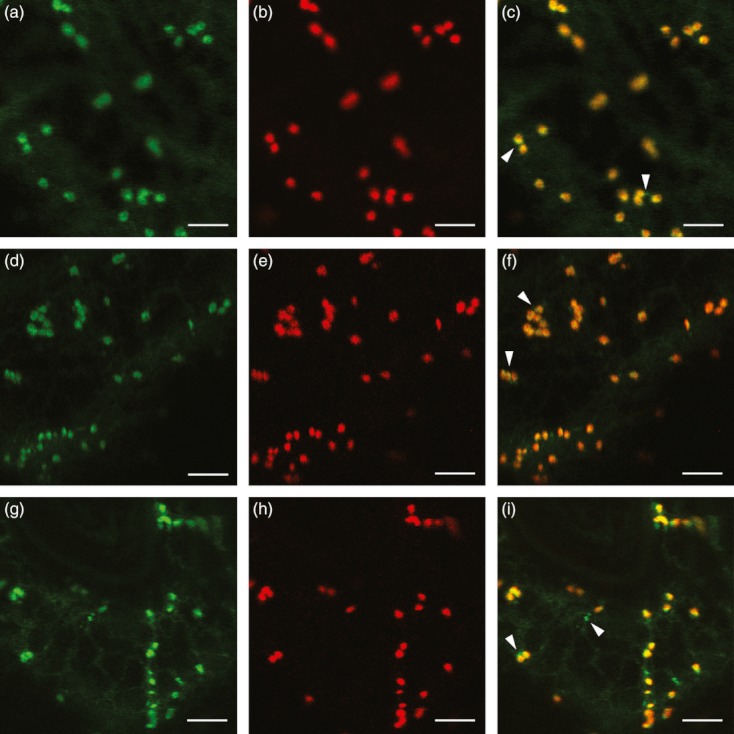
Cellular localization of GFP-tagged MSR (GFP–MSR) proteins. (a) GFP–TfMSR; (d) GFP–AtMSR1; (g) GFP–AtMSR2; (b, e, h) ST-mRFP; (c, f, i) merged images. Arrowheads indicate punctate structures where the ST-mRFP signal was not present or did not completely overlap with the GFP–MSR signal. Scale bar = 5 μm.