
Figure 9.
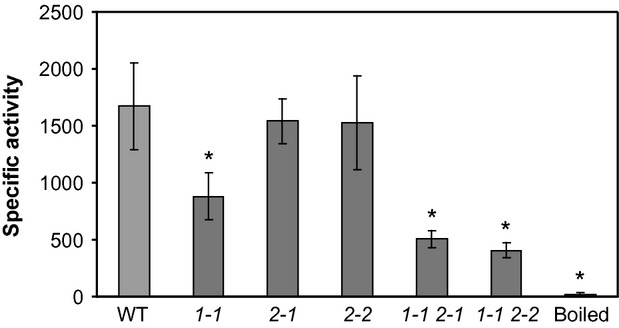
In vitro mannan synthase activity assay of microsomes prepared from stems. Error bars represent the standard deviation of three biological replicates, with three technical replicates for each. The specific activity is shown as pmol GDP-Man incorporation per hour per mg protein. Boiled, boiled wild-type control. Asterisks indicate statistically significant differences relative to the wild-type (Student's t test, P < 3 × 10⁻⁸). 1-1, msr1-1; 2-1, msr2-1; 2-2, msr2-2; 1-1 2-1, msr1-1 msr2-1 double mutant; 1-1 2-2, msr1-1 msr2-2 double mutant.