Fig. 1.
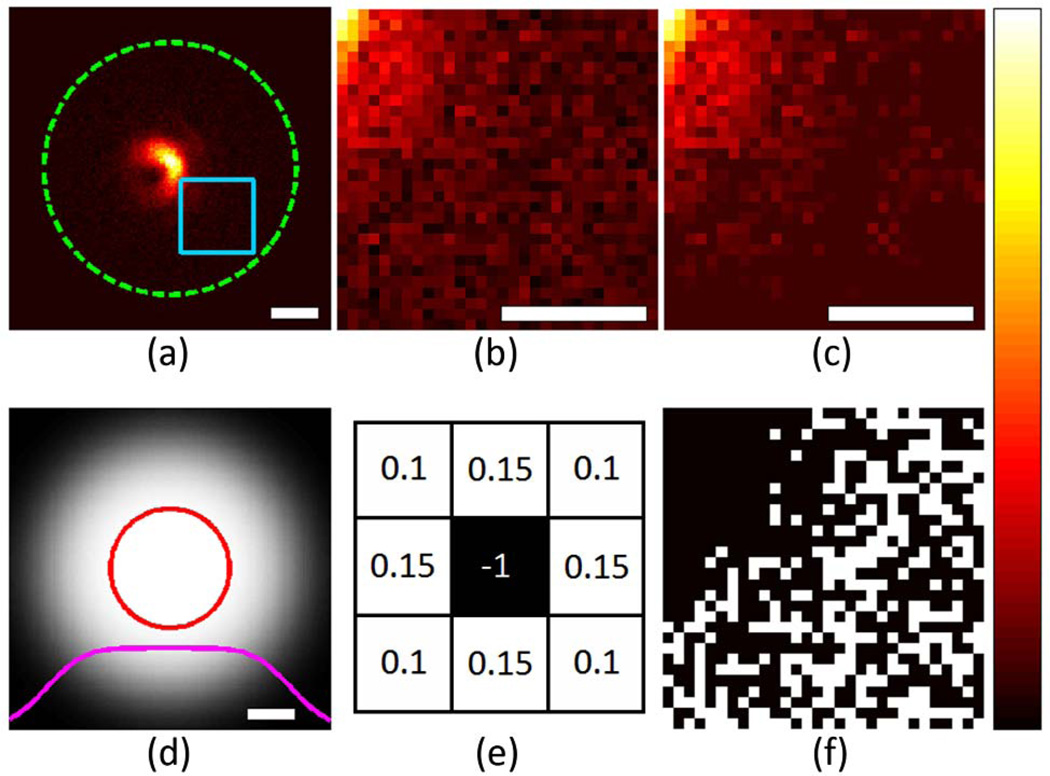
(Color online) (a) Raw image after subtraction of the noise floor (as determined by area outside the dashed green circle) and multiplication with the cleanup filter shown in (d). (b) Magnified region shown in light blue box in (a). (c) Same region after 100 iterations of the noise-suppression scheme using the filter kernel shown in (e). (f) Mask showing pixels with negative values in (b) in white. The solid red circle in (d) encloses values >98% of the maximum. The solid magenta curve shows a central line profile through (d). White scale bars: 1 µm.

