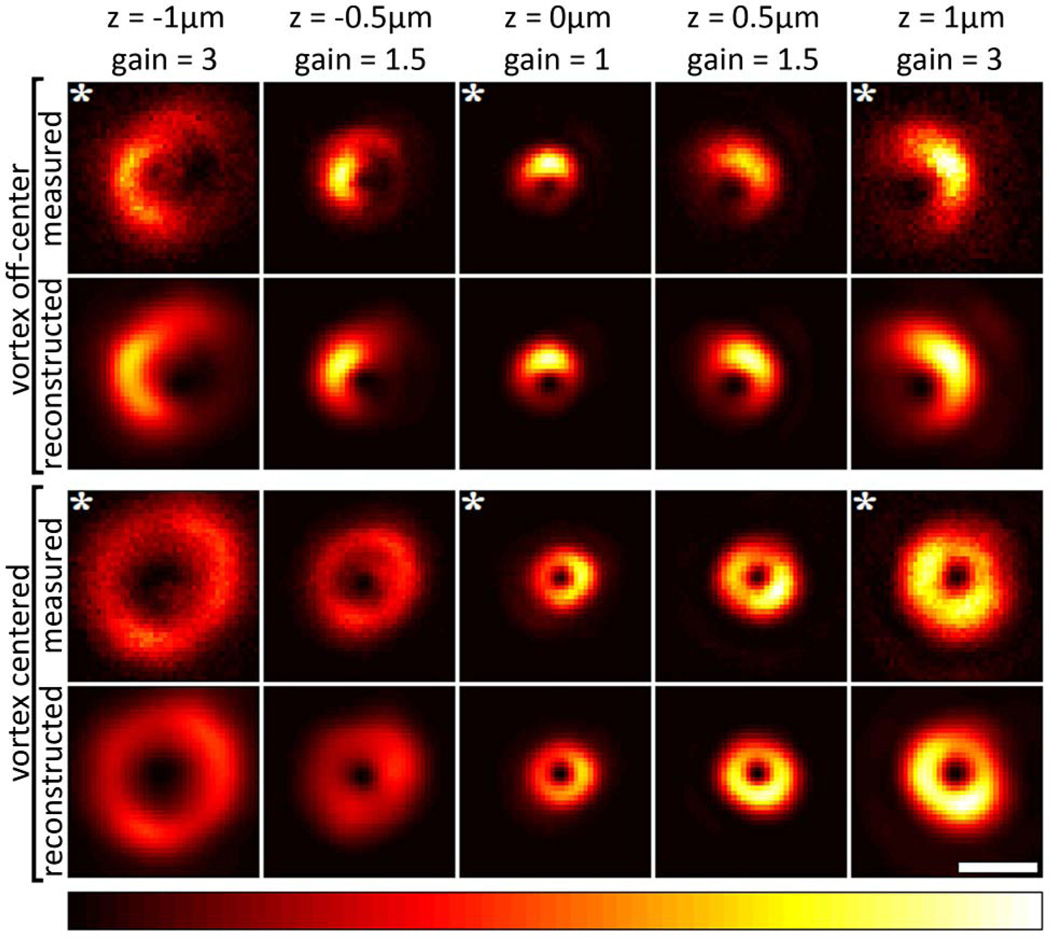
Fig. 3.
(Color online) First and third rows: z-stacks with measured (preprocessed) STED foci. Second and fourth rows: STED foci reconstructed from the retrieved pupil functions (based on images marked by white asterisks). In each row, the intensities are normalized to the highest pixel intensity in that row after applying a gain to the images as indicated above each column. Only the central regions of the images are displayed (the surrounding low-intensity regions were reconstructed equally well). White scale bar: 1 µm.

