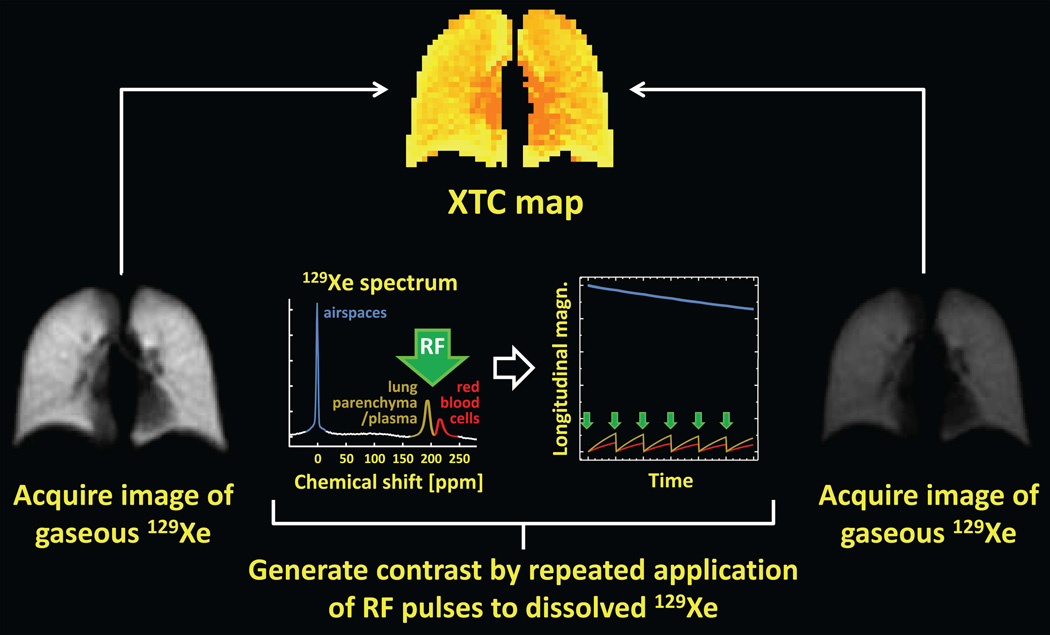
Figure 12.
XTC: Xenon polarization transfer contrast. Following inhalation of hyperpolarized gas, a low-flip-angle, gradient-echo image of gas-phase 129Xe is acquired (left). Next, image contrast reflecting the degree of gas exchange between the airspaces and tissue/blood is generated by applying a series of high-flip-angle RF pulses (green arrows in plots) at the frequency corresponding to the dissolved-phase compartments. During the delay between applications of these contrast-generating high-flip-angle RF pulses, exchange of xenon atoms between the airspaces and tissue/blood causes the gas-phase longitudinal magnetization to decrease (plot on right, blue curve) by an amount proportional to the degree of exchange. Finally, a second low-flip-angle, gradient-echo image of gas-phase 129Xe is acquired (right). Analysis of the changes in signal intensity between the first and second images provides a regional map (top) reflecting the degree of gas exchange that occurred during the delay between contrast-generating RF pulses. For clarity, the dissolved-phase peaks (plot on left) and associated plots of longitudinal magnetization (plot on right) are shown several times larger than actual values.

