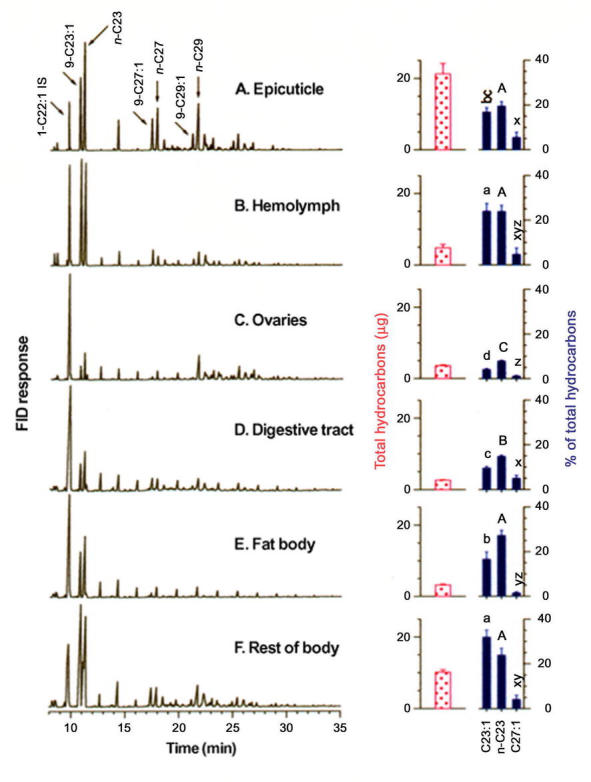
Figure 3.

Gas chromatograms (FID) of hydrocarbons extracted from the epicuticle and various tissues of 6-day-old Musca domestica females. In each chromatogram 1 µg 1-C22:1 represents an internal standard and each chromatogram is scaled to its tallest peak. Above the bars on the right, different letters represent statistically significant differences (P < 0.05) in an analysis of variance followed by LSD of arcsine square-root transformed percentages. Lower case letters a–d represent an ANOVA of Z9-C23:1 in different tissues, capital letters A–C an ANOVA of n-C23 in different tissues, and x–z an ANOVA of Z9-C27:1 in various tissues. n = 5 males or females per mean. Bars represent mean ± SEM.
