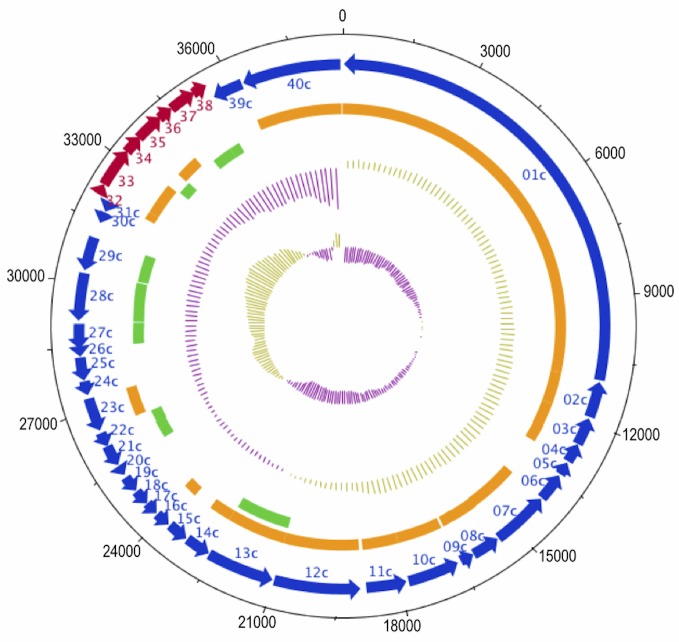
Figure 3.
Genome map of VvAW1. The outer two tracks show numbered predicted genes and direction of transcription (red: forward direction, blue: reverse). The orange and green tracks indicate genes with significant sequence similarity (> 10e-5) to Thalassomonas phage Ba3, and Pseudomonas phage F116, respectively. Moving inward, the tracks show the %GC content (purple=low %GC) and GC skew ([G-C]/[G+C]) (innermost) of the genome.

