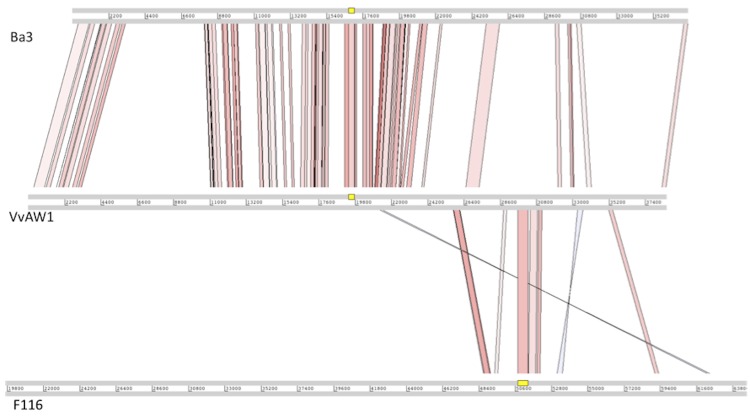
Figure 4.
Whole genome comparison of Vibrio phage VvAW1 to Thalassomonas phage Ba3, and Pseudomonas phage F116. This figure was generated using the Artemis Comparison Tool (ACT) [21]. Genomes were aligned using WebACT, using default tblastx settings, with E-value set to 10e-4, and genetic code set to eubacterial. ACT display was set to show homologous regions with BLAST scores >40, and sequence similarity >25%.

