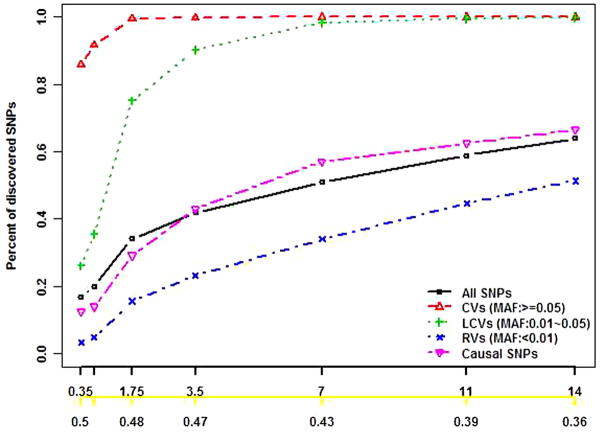
Figure 3. SNP discovery of the two-stage design with extreme phenotype sampling (TS-E) in the GAW17 data.
The black x-axis is the proportion of stage I individuals times 100 (l × 100), and the yellow x-axis is the cost function with Ts/Tw = 0.5. The black, red, green, blue, and pink lines correspond to the percentage of total discovered SNPs, CVs, LCVs, discovered RVs, and causal SNPs, respectively.

