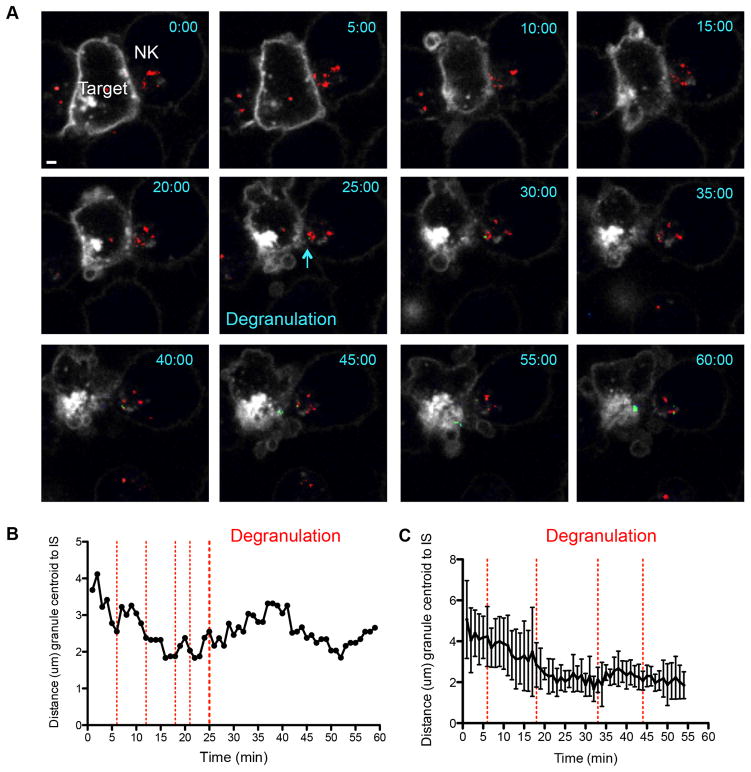
Figure 2.
Visualization of NK cell lytic granule polarization and degranulation by live cell confocal microscopy. NK92 cells expressing pHlourin-LAMP1 (green) were loaded with LysoTracker Red (red) and incubated with Cell Mask labeled K562 cells as in Figure 1. Conjugates were imaged by confocal microscopy at 1 frame per minute for 90–130 minutes. A. One representative conjugate from 4 independent experiments is shown at 10-minute intervals for 60 minutes. One degranulation event is shown at 25 minutes. Scale bar = 1 μm. B. Granule polarization in representative NK92 pHlourin-LAMP1 cell shown in A as measured in Figure 1. Red vertical dashed lines indicate brief individual degranulation events prior to the sustained event beginning at 25 minutes (heavy red dashed line). C. Mean granule polarization from 4 independent experiments (n = 4) with vertical red lines indicating initial degranulation events from each conjugate analyzed. Error bars indicate SD.

