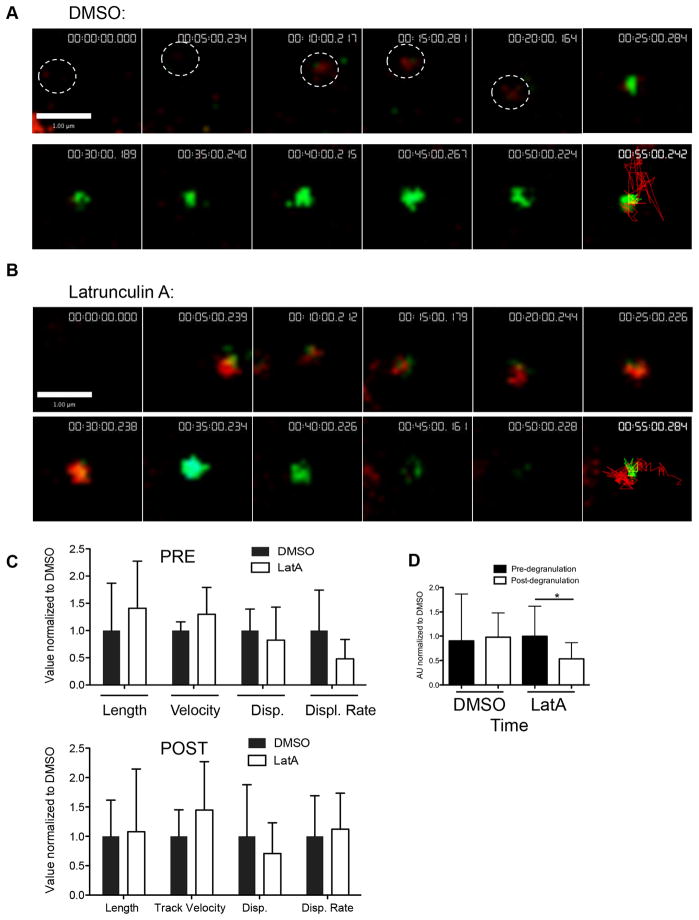
Figure 7. Effect of actin depolymerization upon synaptic lytic granule kinetics.
NK92 cells expressing pHlourin-LAMP1 (green) were loaded with LysoTracker Red (red) and activated upon immobilized antibody to NKp30 and CD18. Cells were imaged by TIRF microscopy at 6 frames per minute for 60–80 minutes. A representative NK92 lytic granule cropped from the image sequence is shown at 5-minute intervals following 5–10 minutes of contact-induced activation. LysoTracker Red and pHluorin-LAMP1 tracks depicting the course of the granule over all timepoints are shown in final 55-minute image. Scale bars=1 μm. A. Vehicle control (DMSO) was added 10–20 minutes following the addition of cells to the imaging chamber. The white circle indicates granules location in frames 1–5. B. LatA was added between 10 and 15 minutes for a final concentration of 10 μM. C. Measured mean characteristics of synaptic lytic granule motility before (black bars) and after (white bars) degranulation. Mean track length, track velocity, displacement, displacement rate, and timespan of lytic granules are all shown relative to the respective DMSO values, which have been normalized to 1. Mean ± SD are shown. Significant differences between DMSO- and Latrunculin A-treated granule tracks are marked with an asterisk (p<0.05, two-tailed t test). Results shown are from 4 independent experiments.

