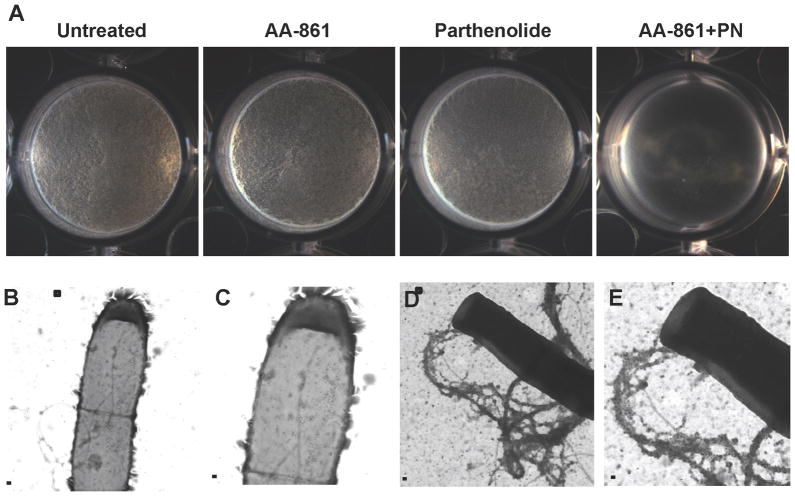
Figure 6. The molecules inhibit biofilm formation with additive effects.
(A) The formation of biofilm by the wild-type strain was evaluated in MSgg medium alone or with the addition 20 μM of each molecule added separately or in combination (20 μM of each). Pictures of the wells were taken after 24 hr of incubation at 30°C. Transmission electron microscopy and immunogold labeling were used to determine the presence or absence of TasA fibers. (B–C) Cells treated with both molecules appeared decorated with gold particles but did not show any TasA fibers. (D–E) Untreated cells showed long fibers labeled with gold particles. Panels C and E are magnified views of the areas marked in panels B and D. Scale bars, 500 nm in panels B & D and 200 nm in panels C & E (see also Figure S3).

