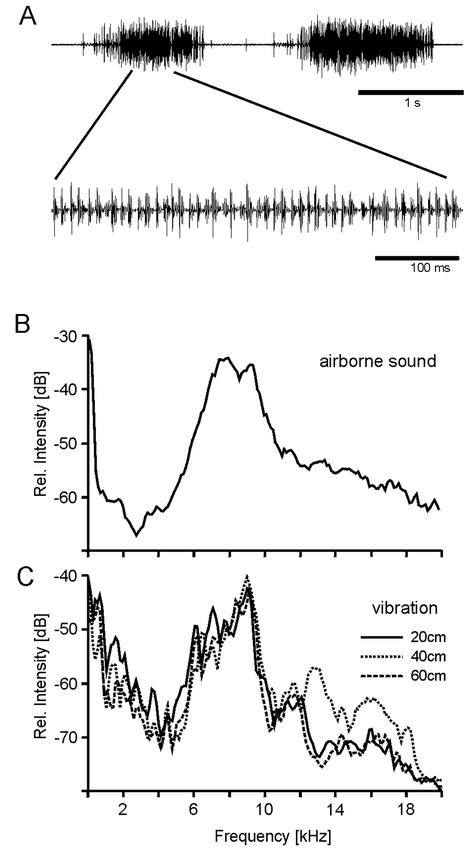
Figure 2. A.

Oscillographic traces of the temporal pattern of sound elicited by electrical stimulation of a male Okanagana rimosa cicada. B. Graph of the frequency spectrum of the airborne sound produced by an electrically-stimulated cicada; overall sound pressure level about 80 dB SPL (rms) measured at a distance of approximately 10 cm. C. Graph of spectra of vibrations produced in a maple branch by the same electrically-stimulated singing male as in B, sitting at a distance of 20, 40 and 60 cm from the accelerometer; the overall peak acceleration was 50 cm/s2.
