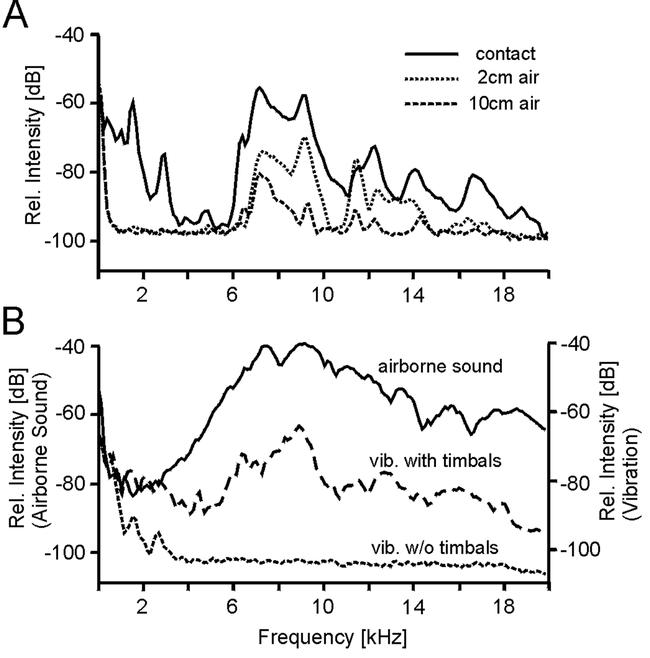
Figure 3. A.

Graph of spectra of relative intensity of vibrations in a maple branch produced by an electrically stimulated singing male, placed at a distance of 10 cm from the accelerometer. Solid line (contact): animal sits on the stick (overall peak acceleration was 45 cm/s2); dashed lines: animal lifted 2 cm (2 cm air) and 10 cm (10 cm air) above and out of physical contact with the stick. B. Graph of spectra of relative airborne sound pressure level and of relative vibration acceleration in a maple branch produced by an electrically stimulated singing male, before and after destroying its timbals. For visualization of the differences all spectra have been similarly scaled, although absolute scales differ. Solid line: (airborne sound) timbals intact; dashed line (vib. with timbals): timbals intact; narrow dashed line (vib. w/o timbals): both timbals destroyed. Vibrations (vib.) recordings from an animal in contact with the branch in 10 cm distance to the accelerometer.
