
Figure 2.
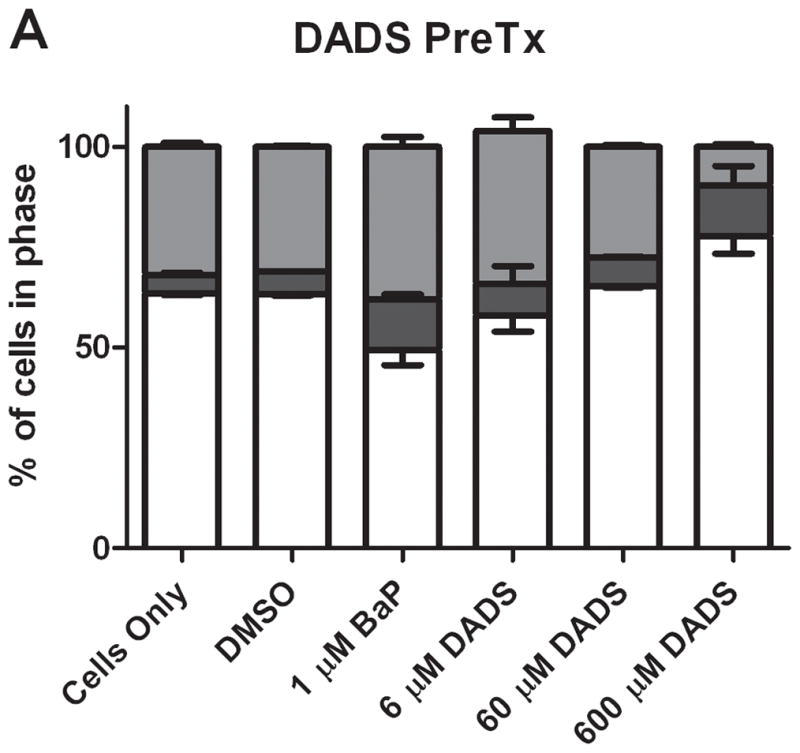

Results of cell cycle analysis of MCF-10A cells treated with BaP and DADS. MCF-10A cells were either PreTx with DADS for four hours, followed by treatment with 1 μM BaP for 24 hours (A) or CoTx with DADS and BaP for 24 hours (B). The cells were fixed in ethanol, stained with propidium iodide, and analyzed by flow cytometry. The values represent the average percent of cells in each phase, G1, G2/M, and S +/− SEM.