Figure 2. .

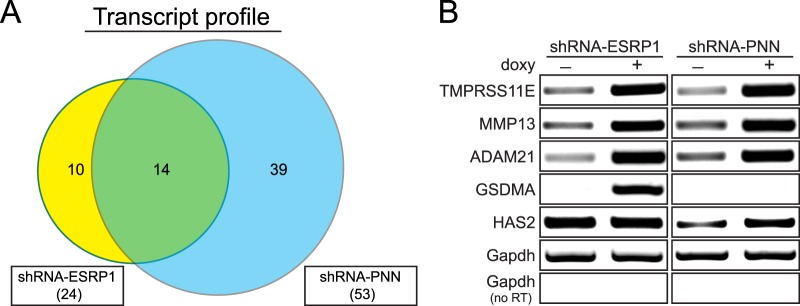
Similar impacts of PNN and ESRP1 on transcript profile. (A) A Venn diagram shows the number of upregulated protein-coding genes upon ESRP1 (yellow) or PNN (blue) knockdown. The total number of such genes for each cell line is shown in parentheses. Fold change in transcript level >1.5, P value < 0.05. (B) Validation of transcript levels of candidate genes from exon array by semiquantitative RT-PCR assays confirms specific alterations in transcript level of several representative genes. Three genes commonly upregulated in both cell lines and one unique gene from each cell line were chosen as examples of validation.
