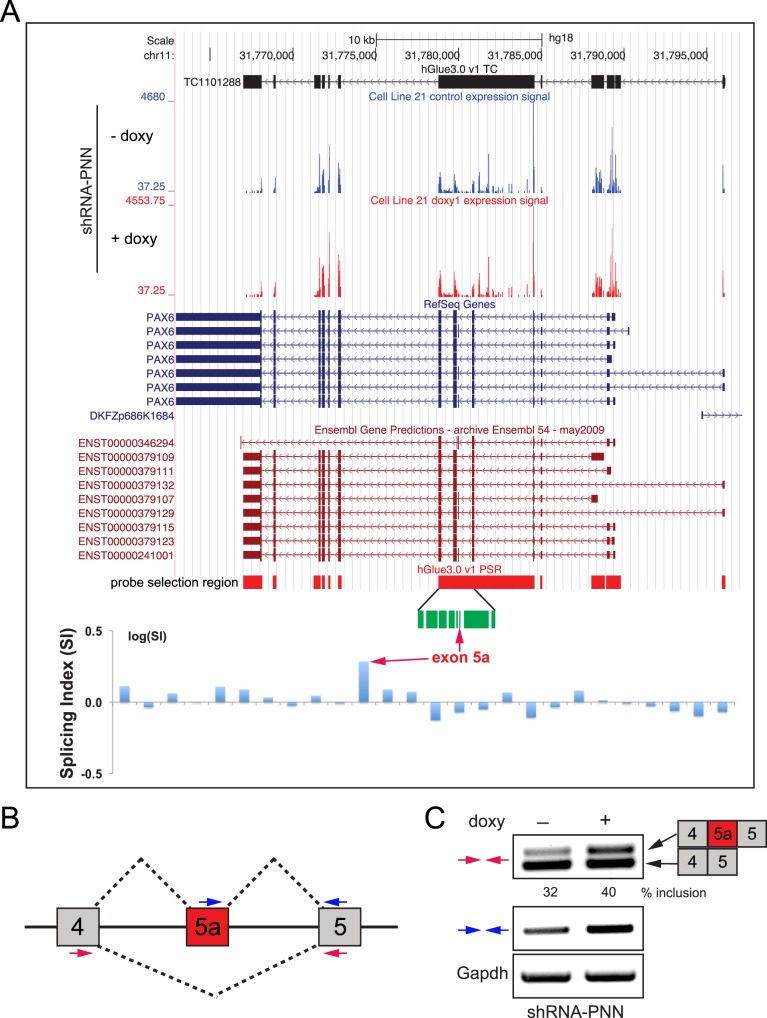
Figure 5. .
Impact of PNN on alternative splicing of PAX6. (A) UCSC genome browser view (human genome assembly hg18) of PAX6 locus is shown with exon array expression signal levels for control and doxycycline-treated shRNA-PNN HCET cells (blue, RefSeq entries; red, Ensembl transcripts). Probe selection region (PSR) of hGlue3_0 exon array is shown with an amplified view of exon 5a region (in green). Normalized splicing indices for each probe set are presented as bar graphs in logarithmic scale. Note the elevated splicing index for exon 5a (red arrows). (B) A schematic diagram shows the splicing pattern and exon structure of PAX6 around exon 5a. Two sets of primers used for RT-PCR validation are shown in colored arrows. (C) Separate RT-PCR validation assays confirm increased inclusion of exon 5a upon PNN knockdown in HCET cells.

