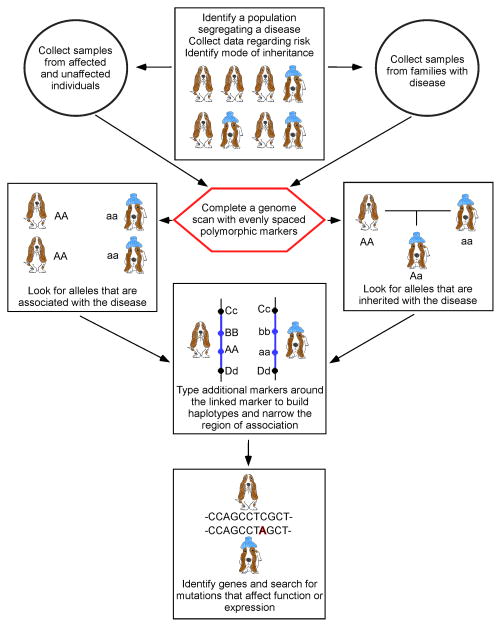
Figure 2.
Flow chart for designing a mapping study. The flow chart shows the basic steps for designing a mapping study using either families or cases and controls. Affected individuals are designated by the blue ice pack on the head. The unaffected individuals have no head gear. Arrows indicate order of tasks. Alleles at each hypothetical locus are represented by uppercase and lowercase versions of the same letter.

