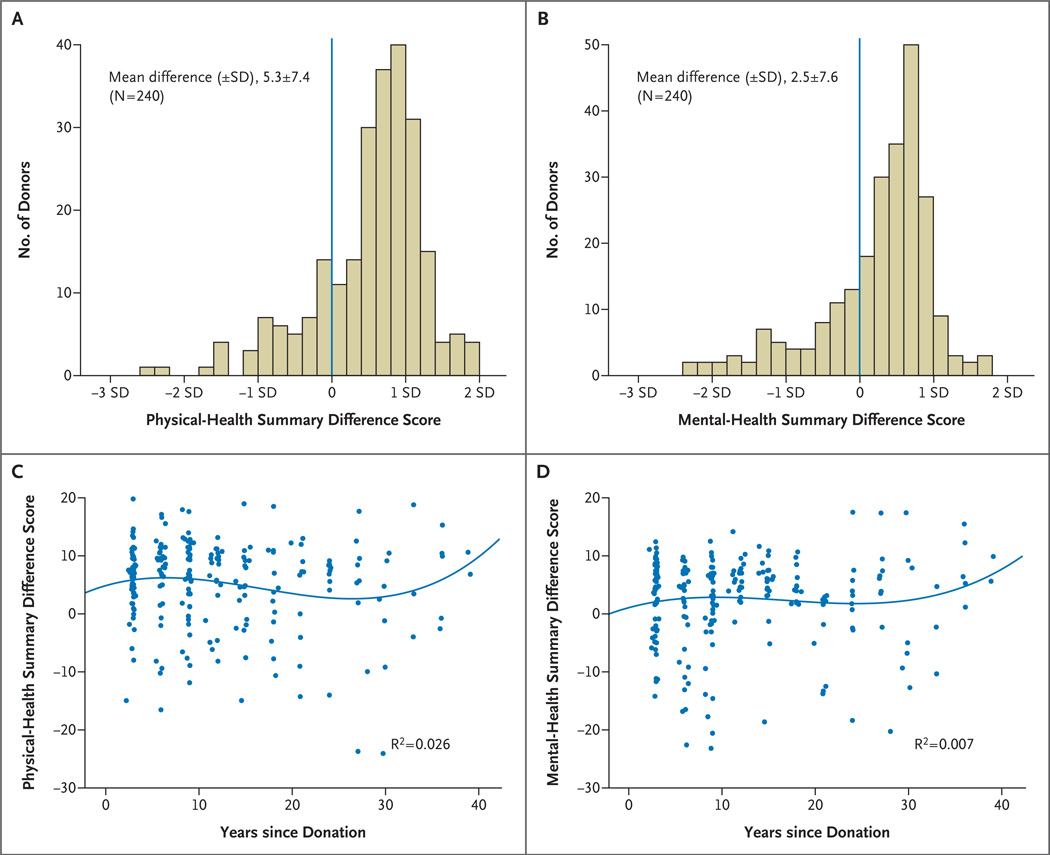
Figure 3. Quality-of-Life Scores for Kidney Donors.
The physical-health and mental-health summary scores, adjusted for age and sex, as compared with population norms, are shown in Panels A and B, respectively. In the case of the physical-health summary score, 40.4% of the scores were below the mean, and 59.6% were above the mean. In the case of the mental-health summary score, 38.0% of the scores were below the mean, and 62.0% were above the mean. The blue lines in Panels A and B represent the population norms. The relationship of the physical-health and mental-health summary scores, adjusted for age and sex, to time since donation is shown in Panels C and D, respectively. The lines in Panels C and D are the regression lines.

