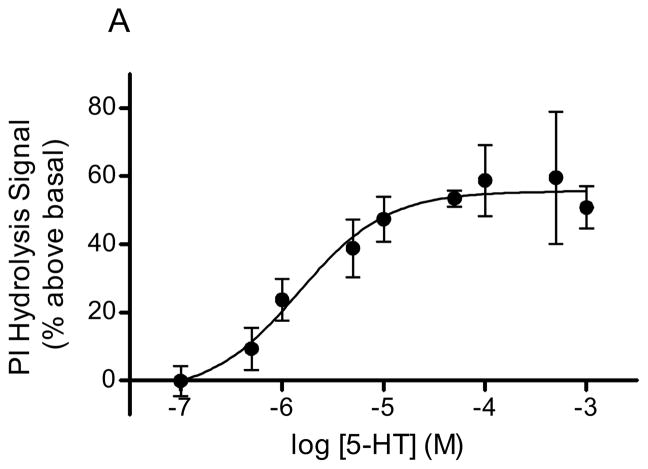
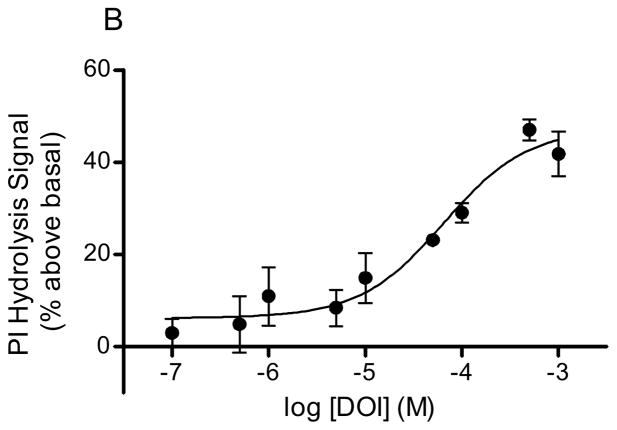
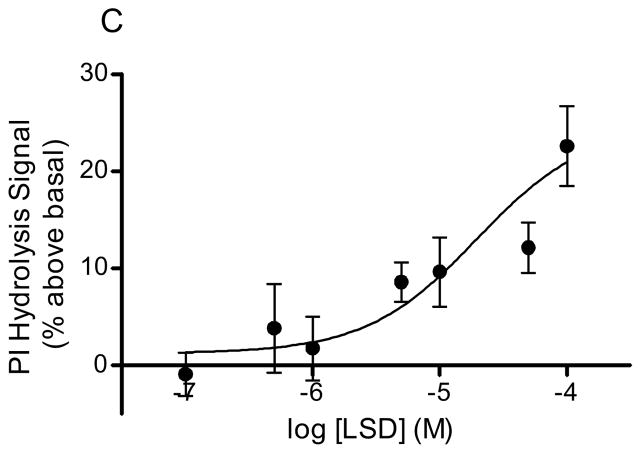
Figure 1. Hallucinogen-stimulated in vitro PI hydrolysis.
PI hydrolysis was measured in rabbit frontocortical tissue prisms through release of [3H]IP1. The concentration curves for 5-HT (A, n=4), DOI (B, n=3), and LSD (C, n=10) are shown. The maximum concentration of LSD was 100μM, whereas the maximum concentration for 5-HT and DOI was 1mM.


