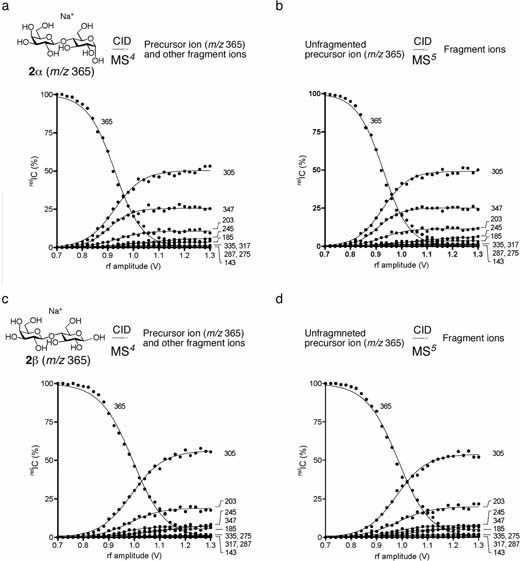
Fig. 2.

a. ERMS spectrum of 2α (m/z 365) at the MS4 stage. b. ERMS spectrum of the unfragmented precursor (m/z 365) isolated during CID of 2α at the MS5 stage. The d value and r2 between spectra 2a and 2b were 0.867 and 0.997, respectively. For d value, see experimental section. c. ERMS spectrum of 2β (m/z 365) at the MS4 stage. d. ERMS spectrum of the unfragmented precursor (m/z 365) isolated during CID of 2βat the MS5 stage. The d value and r2 between spectra 2c and 2d were 0.966 and 0.997, respectively. For d value, see experimental section.
