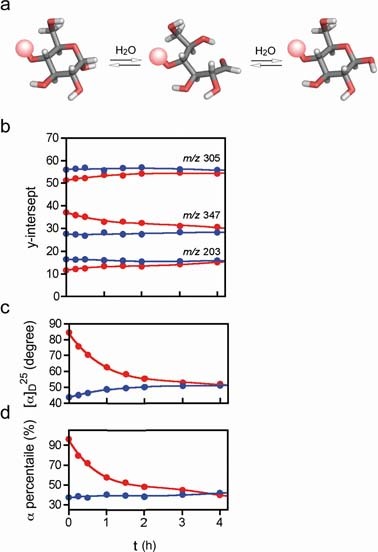
Fig. 5.

a: Schematic representation of the anomerization of lactose; galactose residue is shown as a red sphere. Gray: carbon; white: hydrogen; red: oxygen. b: Observation of equilibrium between α-enriched (8, red) and β-enriched lactose (9, blue). Relative intensities (calculated using the plateau values estimated for each product ion in the ERMS plot) of common fragments (m/z 203, 305 and 346) observed for both reactions. c: Data obtained using a polarimeter. Colors used are same as in Fig. 5b. d: Data obtained by 1H NMR. The α/β ratios calculated for anomeric protons were used. Colors used are same as in Fig. 5b.
