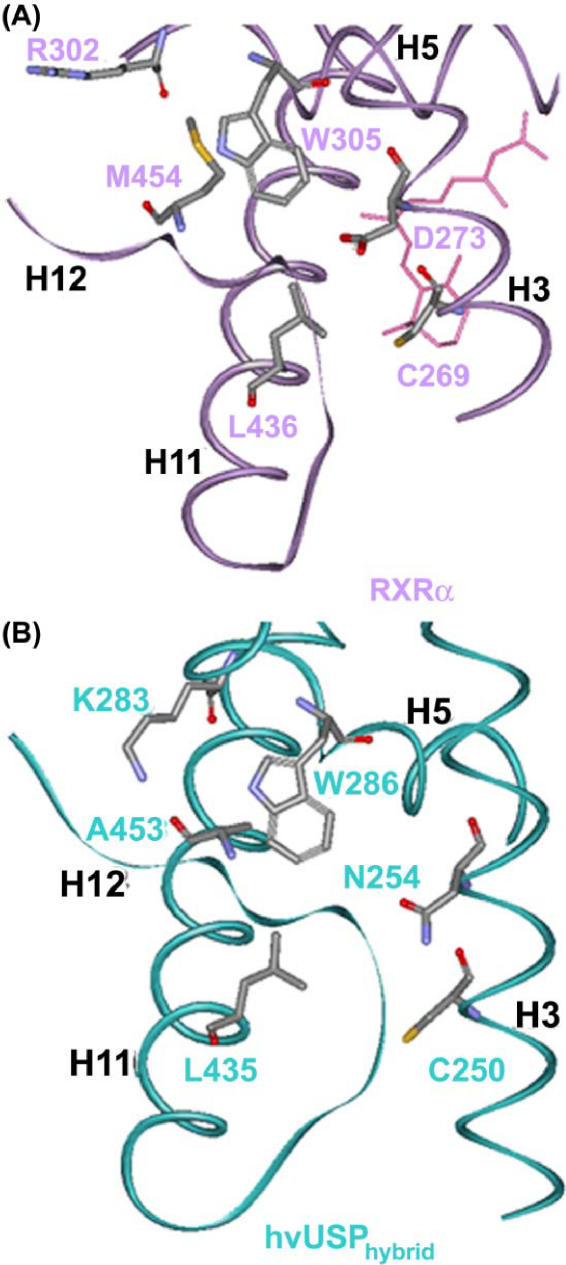
Figure 3.
The agonist conformation of the transactivation helix H12 in hsRXRα and in the hvUSP hybrid model. Protein is depicted as a backbone carbon C? trace. Atoms are represented in standard color scheme: carbon: grey, nitrogen: blue, oxygen: red, sulfur: yellow. (A) Details of the interactions stabilizing the helix H12 in its agonist position in the RXRα LBD (in light purple). The contacts are due to residues in helices H3, H5, H11 and H12. The side chains of residues participating to the interactions are labeled. (B) The same region as in (A) for the hvUSP LBD hybrid homology model (in light blue).

