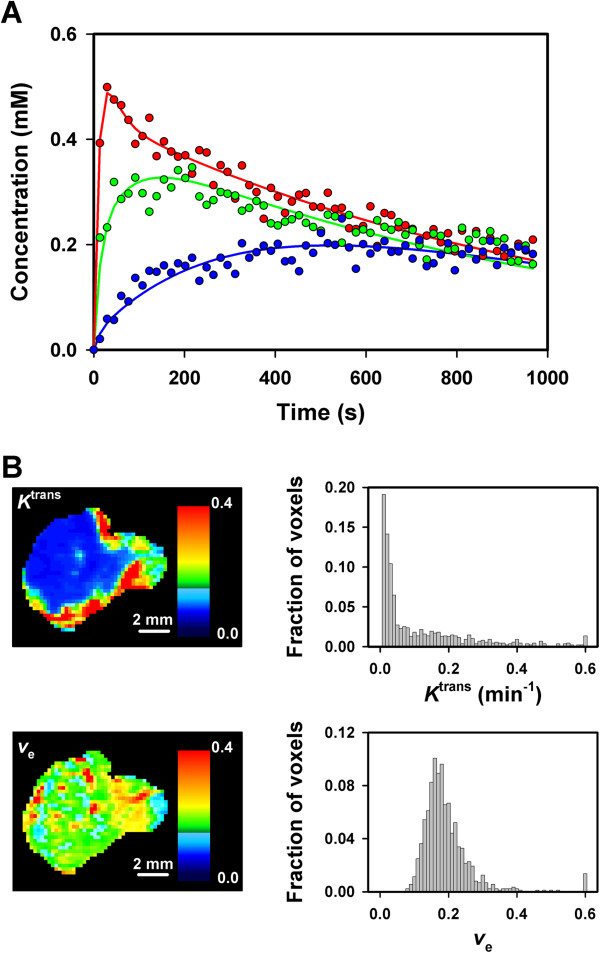
Figure 1.
DCE-MRI data for CK-160 cervical carcinoma xenografts imaged with Gd-DTPA as contrast agent. (A) Gd-DTPA concentration versus time for three representative single voxels of a tumor. The curves were fitted to the data by using the Tofts pharmacokinetic model. (B) The parametric images of Ktrans and ve and the corresponding Ktrans and ve frequency distributions of a representative tumor.

