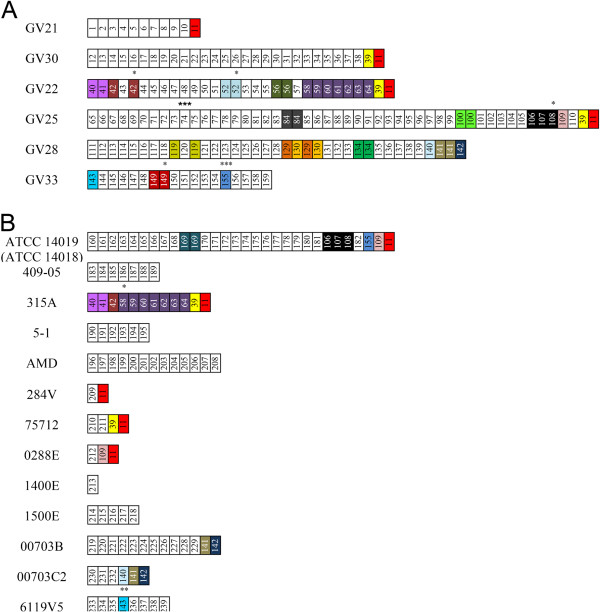
Figure 3.
Graphic representation of CRISPR spacers in G. vaginalis clinical isolates (A) and G. vaginalis genomes deposited in GenBank (B). Spacers are represented by boxes; repeats are not included. The leader-end spacers are oriented on the left of each array; the trailer-end spacers are oriented on the right side of each array. Identical spacers are represented by the same number and colour. Unique spacers are white-coloured. Spacers with mismatches of up to three nucleotides (see Methods) are indicated by dots on the top of the spacer. The number of dots shows the number of mismatched nucleotides.

