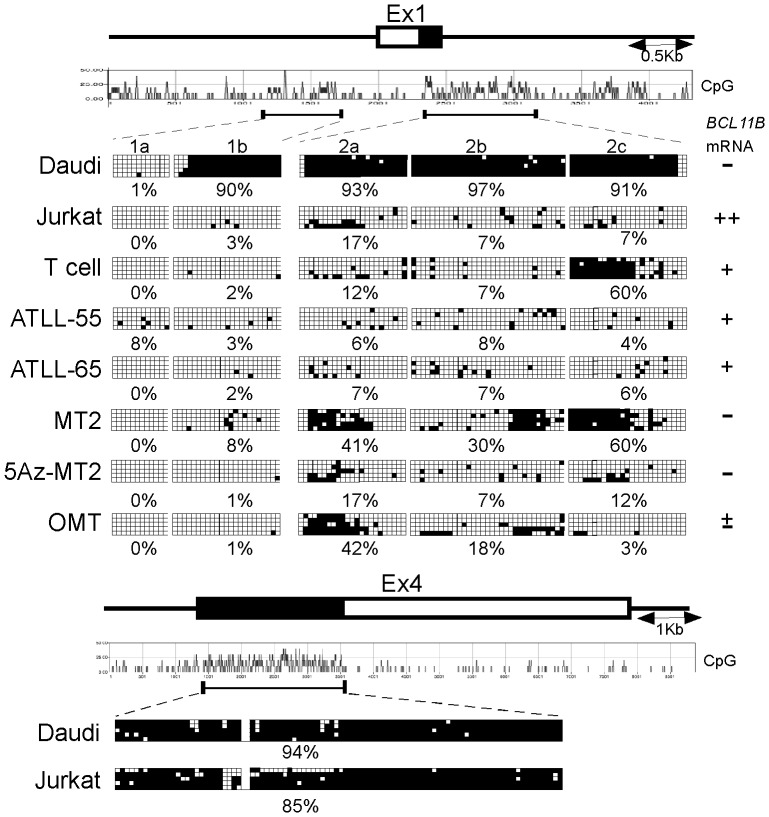
Figure 4. The analysis of DNA methylation of CpG islands in the BCL11B locus.
(A) The genomic organization of the human BCL11B locus and the position of CpG islands. Each box indicates an individual clone sequenced in the analysis after bisulfite treatment and PCR. The open boxes indicate CpG sites at which no DNA methylation was detected. The filled boxes indicate the CpG sites at which DNA was methylated. The frequency of the CpG methylation in each region is shown. 5Az-MT2 indicates the MT2 cells treated with 5Az.

