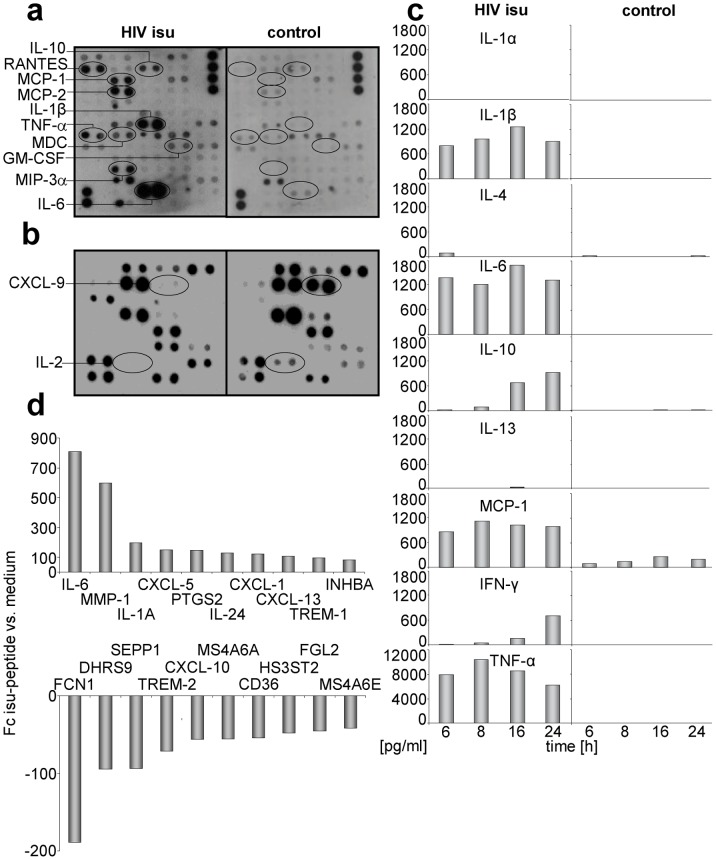
Figure 2. Influence of the isu peptide on cytokine release and gene expression.
(a) PBMCs were incubated for 24 hrs with or without the isu peptide homopolymer. The cytokine array VI (see Material and Methods) was used. The up-regulated cytokines are circled. (b) PBMCs were treated with Con A and incubated with and without the isu peptide homopolymer for three days and the cytokine array I was used. The down-regulated cytokines are circled. Similar results were obtained with PBMCs from ten other donors. (c) Cytokine array measuring simultaneous release of ten different cytokines after incubation of PBMCs from one donor with and without the isu peptide homopolymer at different time points (6 to 24 hrs), confirming and extenting the results shown in Figure 2a. Control PBMCs were incubated with medium. Compare the increase in IL-10 expression with that in Figure 3a. (d) Genes with the highest up-regulation (upper part) and down-regulation (lower part) of expression in PBMC of one donor in response to the isu peptide treatment. Using specific real-time PCRs for the up- and down-regulated genes, the changes were confirmed in PBMCs of other donors (Figure 3, 4, Supplementary Figure S2). Fold changes (Fc) indicates gene expression compared to control cells incubated in medium. The full names of the genes are given in Supplementary Table S4.

