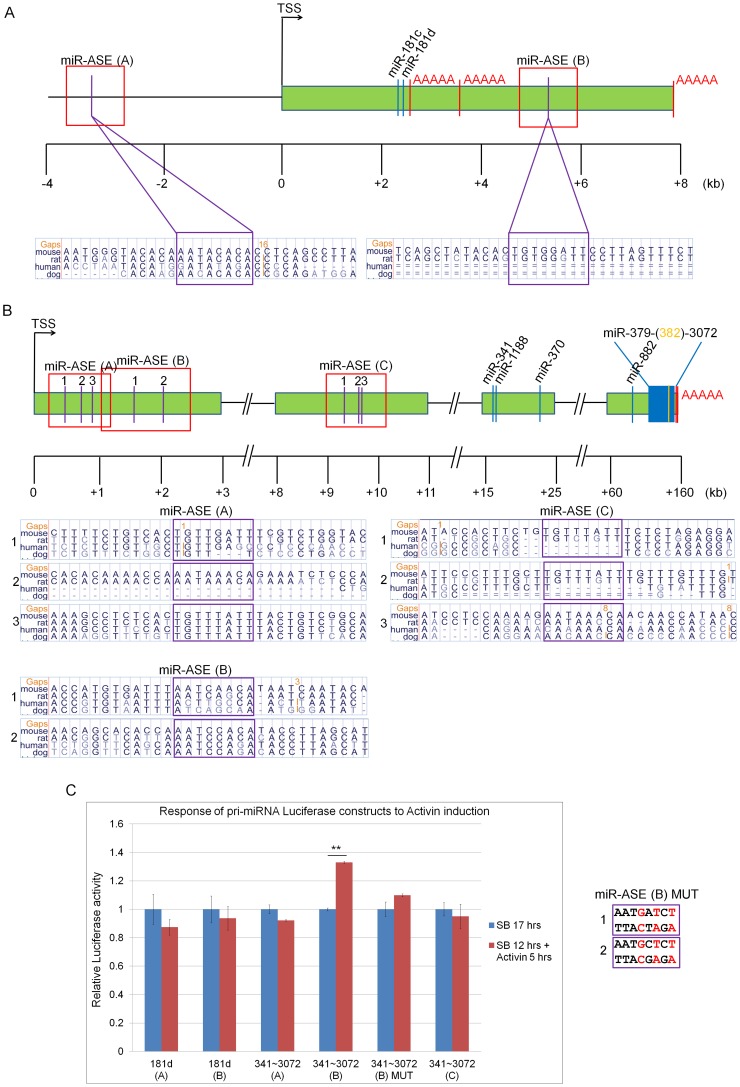
Figure 3. Predicted gene structure of pri-miRs-181c/d and -341∼3072 and validation of FoxH1 binding sites.
(A, B) Schematic representations of the predicted gene structures of pri-miR-181c/d (A) and pri-miR-341∼3072 (B). The putative FoxH1 binding sites (Asymmetric Enhancer Elements, ASE) are indicated in purple. Sequence and species conservation of the ASE, in purple boxes, are shown below the respective gene maps. Positions of miRNAs are indicated with blue lines and in yellow for miR-382 (B). ‘AAAA’ in red denotes the predicted poly(A) tails. A red box highlights sequence fragments used for each pri-miRNA expression luciferase construct. TSS – transcriptional start site. (C) Candidate putative miR-ASE sites were tested by luciferase assay in ES cells treated with SB-431542 (SB) for 12 hrs followed by Activin for 5 hrs or with a further SB treatment of 5 hrs (SB 17 hrs). The nucleotides mutated to generate the miR-ASE(B)MUT construct are presented in the panel to the right of the graph. Student’s t-test was used for the statistical analysis (**p<0.01). Assays were performed in 3 biological replicates measured in quadruplicate (n = 3). Error bars show ±SEM.

