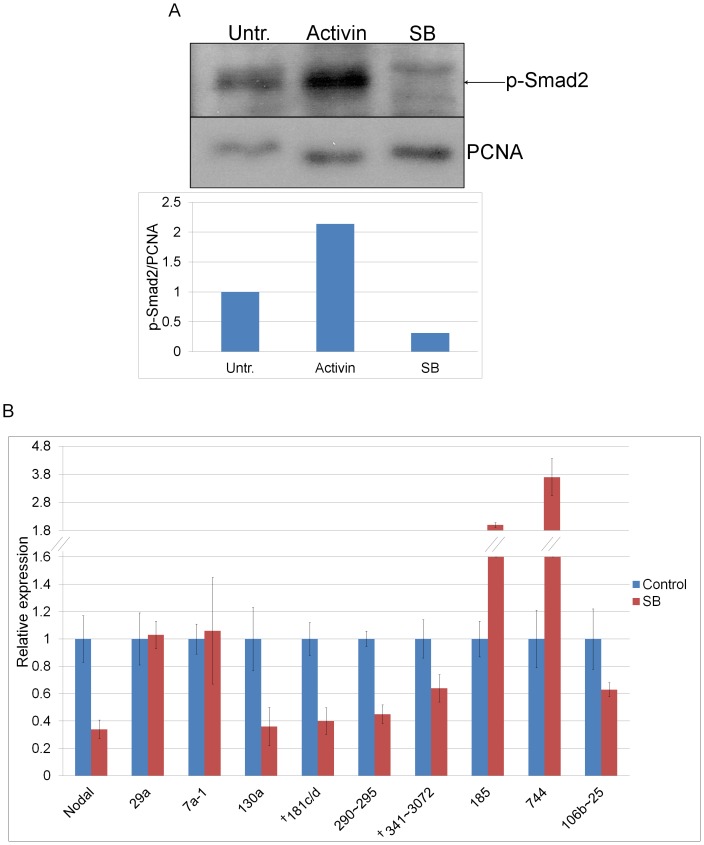
Figure 5. p-Smad2/3 inducible miRNAs respond to changes in p-Smad2/3 signaling in the early embryo.
(A) Western blot analysis of p-Smad2 and PCNA (loading control) levels in pooled E6.5 embryos untreated (Untr.) or treated with Activin or SB-431542 (SB) for 3.5 hrs. The graph presents p-Smad2 levels normalized to corresponding PCNA levels. (B) qPCR analysis of p-Smad2/3 inducible pri-miRNAs on RNA isolated from pooled E6.5 embryos treated with SB or 0.1% DMSO (SB solvent, Control) for 5 hrs. The relative expression was calculated by normalizing to Gapdh for Nodal and to pri-miR-17 (non-Smad2/3 responsive control) for the pri-miRNAs. Pri-miR-7a-2 was not detected. Error bars show ±SEM of triplicate assays. †Denotes direct p-Smad2/3 target miRNAs.

