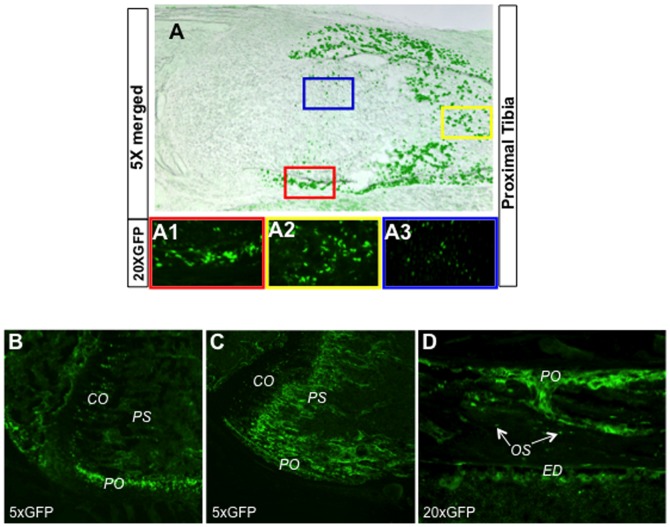
Figure 1. Characterization of Osx-Cre in embryonic and postnatal mice.
(A) Detection of GFP in a section through the proximal end of tibia of Osx-Cre mice at E18.5. Shown is the merged picture from bright-field and green fluorescence images of the same section. (A1–A3) Higher-magnification green fluorescence images of areas in color-coded boxes in A representing perichondrium (A1), primary spongiosa (A2) and columnar chondrocytes (A3). (B, C) GFP detection in sections through the distal femur of Osx-Cre (B) or Osx-Cre;R26-mT/mG mice at 6 weeks of age (C). (D) GFP detection in a section through the tibial cortex of an Osx-Cre; R26-mT/mG mouse at 6 weeks of age. Images at a higher magnification in D than B and C. CO: columnar chondrocytes; PO: periosteum; PS: primary spongiosa; OS: osteocytes; ED: endosteum.

