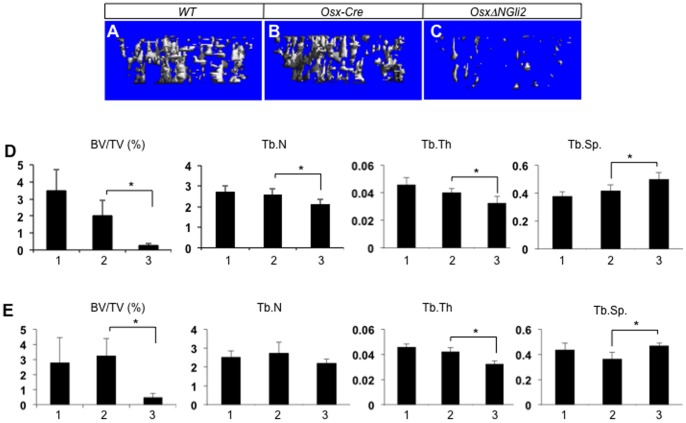
Figure 4. µCT analyses of trabecular bone in the proximal tibia of 6-week-old mice.
(A–C) Examples of 3-D reconstruction images of the primary spongiosa in male mice with indicated genotypes. (D–E) Bone morphometric parameters from µCT analyses of the primary spongiosa in males (D) or females (E). 1: wild type; 2: Osx-Cre; 3: OsxΔNGli2. n = 3; *: p<0.05; error bar: STDEV.

