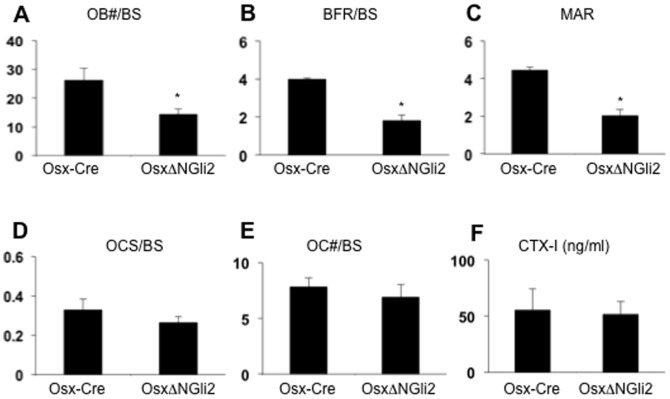
Figure 5. Analyses of osteoblasts and osteoclasts in 6-week-old male mice.
(A) Osteoblast number normalized to bone surface. (B-C) Bone forming rate per bone surface (B) and mineral apposition rate (C) from dynamic histomorphometry. (D-E) Osteoclast surface (D) and number (E) normalized to bone surface. (F) Serum CTX-I assays.

