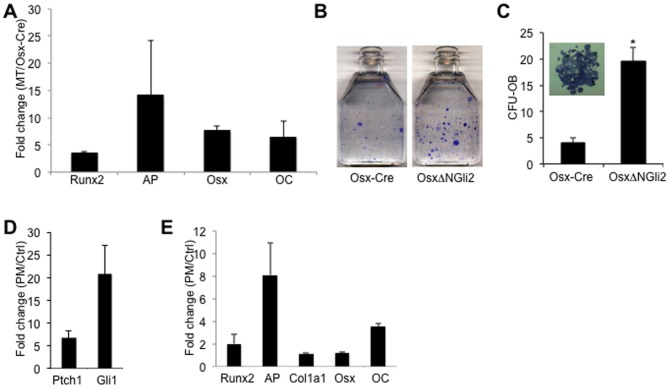
Figure 7. Osteoblast differentiation in vitro.
(A) Relative expression of osteoblast markers in cultures of cells isolated from bone chips of 6-week-old OsxΔNGli2 (MT) versus Osx-Cre male mice. Data by qPCR from either genotype was first normalized to GAPDH before fold changes were calculated. n = 3; p<0.05; error bar: STDEV. (B) Representative image of CFU-OB assays from 6-week-old male mice. Colonies visualized by AP activity staining. (C) Quantification of CFU-OB. A typical CFU-OB shown in inset. Shown is average from three flasks for each genotype. *: p<0.05. (D–E) Relative expression of Hh target genes (D) or osteoblast markers (E) in cultures of sorted Osx-expressing cells from bone chips of Osx-Cre mice, with treatment of purmorphamine (PM) or vehicle (Ctrl). Data by qPCR from either genotype was first normalized to GAPDH before fold changes were calculated. n = 3; p<0.05; error bar: STDEV.

