
Figure 4. Forest plot of the HR for PFS for standard 1 and standard 2. a: standard 1; b: standard 2.
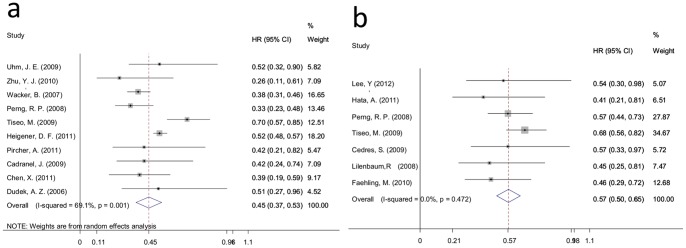
The squares and horizontal lines correspond to the study-specific HR and 95% CI. The area of the squares reflects the weight (inverse of the variance). The diamond represents the summary HR and 95% CI.