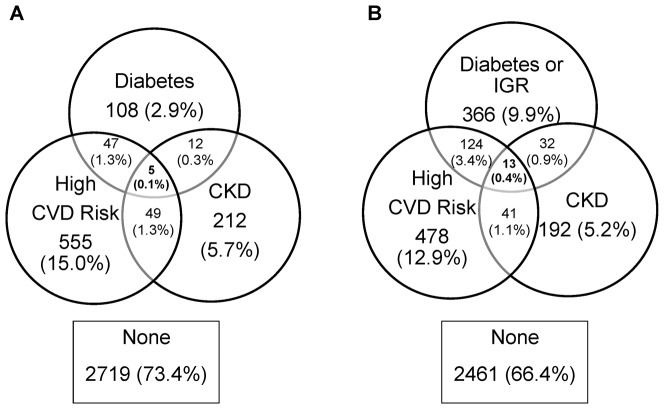
Figure 2. Joint Prevalence of Vascular Risk Factors.
The Figure shows the joint prevalence of screen-detected diabetes, impaired glucose regulation (IGR), high cardiovascular disease (CVD) risk, and chronic kidney disease (CKD) in a UK-based screening study. Note that these diagrams assume that those with missing data do not have the risk factor(s) for which data are unavailable. Panel A shows the overlap between diabetes, high CVD risk and CKD. Panel B shows the overlap between diabetes or IGR, high CVD risk and CVD.

