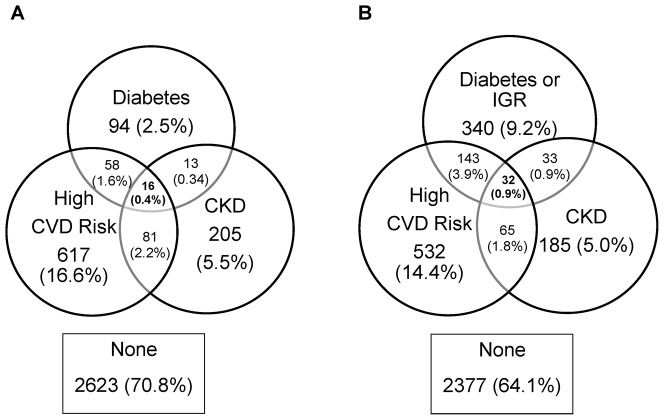
Figure 3. Joint Prevalence of Vascular Risk Factors with Sensitivity Analysis for Missing Data.
Sensitivity analysis showing the joint prevalence of screen-detected diabetes, impaired glucose regulation (IGR), high cardiovascular disease (CVD) risk, and chronic kidney disease (CKD) assuming that those with missing data have the risk factor(s) for which data are unavailable. Panel A shows the overlap between diabetes, high CVD risk and CKD. Panel B shows the overlap between diabetes or IGR, high CVD risk and CVD.

