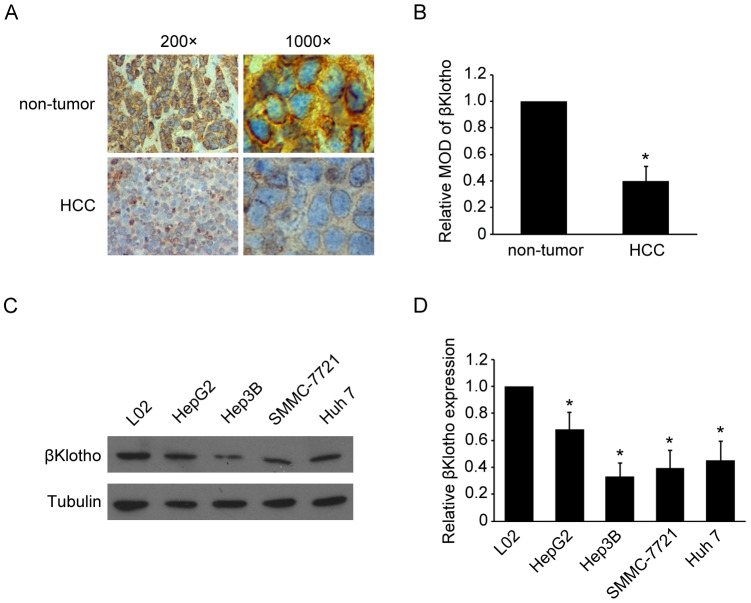
Figure 1. Decreased expression of βKlotho in HCC tissue and hepatoma cell lines.
(A) Immunohistochemical analysis of βKlotho protein expression in non-tumor liver samples and HCC samples. Representative photographs were taken at ×200 or ×1000 magnifications. (B) Statistical quantification of relative MOD of βKlotho staining in non-tumor liver samples and HCC samples (47 cases). (C) Western blot analysis and (D) statistical quantification of βKlotho expression in hepatoma cell lines (HepG2, Hep3B, SMMC-7721 and Huh 7) and normal hepatocyte cell line (L02). Tubulin expression levels were used as internal controls. * indicates p < 0.05. The experiments were performed independently three times at least.

