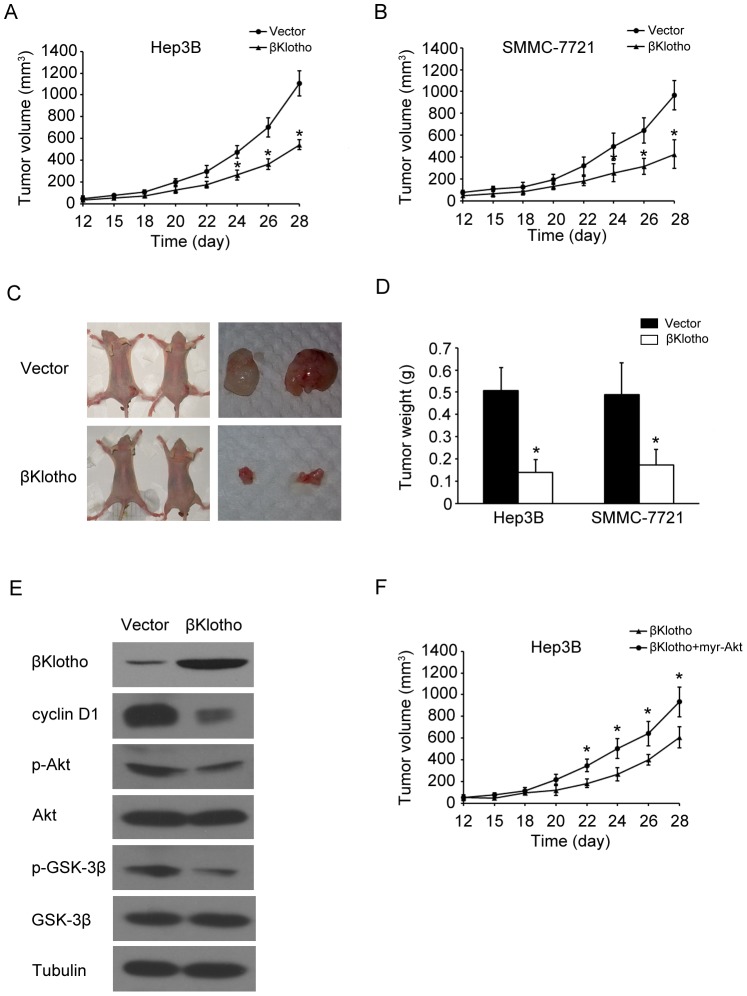
Figure 5. Overexpression of βKlotho suppressed tumor formation.
(A, B) Subcutaneous tumor growth curve of βKlotho-transfected Hep3B or SMMC-7721 cells in nude mice was compared with vector transfected cells. The βKlotho group showed a retarded tumor growth compared to the vector group. (C) A representative picture of tumor growth in nude mice subcutaneously inoculated with vector or βKlotho transfected hepatoma cells. The βKlotho group showed a retarded tumor growth compared to the vector group. (D) The mean tumor weights in nude mice subcutaneously inoculated with vector or βKlotho transfected hepatoma cells. (E) Western blotting analysis of βKlotho, cyclin D1, phosphorylated Akt (p-Akt), Akt, phosphorylated GSK-3β (p-GSK-3β), GSK-3β and tubulin levels in the subcutaneous Hep3B cells tumor samples. (F) Subcutaneous tumor growth curve of βKlotho-transfected Hep3B cells in nude mice was compared with βKlotho and myr-Akt co-transfected cells. The βKlotho plus myr-Akt group showed a retarded tumor growth compared to the βKlotho alone group. The data were means ± SD of three separate experiments. * indicates p < 0.05.

