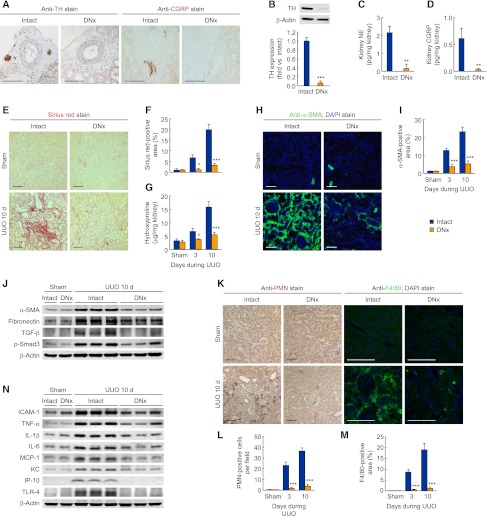
Figure 1.
Renal denervation (DNx) prevents tubulointerstitial fibrogenesis and inflammation during UUO. Renal denervation in left kidneys of male 129S1/SvImJ mice aged 8–10 weeks was carried out; 2 days after the onset, the left ureters were obstructed for 3 or 10 days. (A) Immunohistochemistry of TH and CGRP in renal denervation or intact kidneys (n=4 in each group). (B) TH expression in renal denervation or intact kidneys using Western blot analysis (n=4 in each group). (C and D) Norepinephrine (NE) and CGRP protein level in renal denervation or intact kidneys using ELISA. (E–G) Collagen deposition using Sirius red staining (E and F) and hydroxyproline measurement (G) after UUO or sham operation in renal denervation or intact kidneys (n=4 in each sham-group, n=6 in each UUO-group). (F) The Sirius red–positive area was measured in five randomly chosen high-power (×200) fields per kidney using NIH ImageJ software. (H and I) Immunohistochemistry of α-SMA in UUO or sham kidneys after renal denervation or intact kidneys (n=4 in each sham group, n=6 in each UUO group). The visible blue color indicates nuclei stained by DAPI. (I) The α-SMA–positive area was measured in five randomly chosen high-power (×200) fields per kidney using NIH ImageJ software. (J) α-SMA, fibronectin, TGF-β, and p-Smad3 expression using Western blot analysis in UUO or sham kidneys after renal denervation or intact kidneys (n=4 in each sham group, n=6 in each UUO group). Anti–β-actin antibody served as a loading control. (K–M) Immunohistochemistry of PMN and F4/80 in UUO or sham kidneys after renal denervation or intact kidneys. (L) The number of PMN-positive neutrophil was counted in five randomly chosen high-power (×200) fields per kidney (n=4 in each sham group, n=6 in each UUO group). (M) The F4/80-positive area was measured in five randomly chosen high-power (×200) fields per kidney using NIH ImageJ software (n=4 in each group). (N) ICAM-1, TNF-α, IL-1β, IL-6, MCP-1, KC, IP-10, and TLR4 expression using Western blot analysis in UUO or sham kidneys after renal denervation or intact kidneys (n=4 in each sham group, n=6 in each UUO group). Anti–β-actin antibody served as a loading control. Scale bars, 50 μm. *P<0.05, **P<0.01, ***P<0.001 versus intact kidneys. Error bars represent SDs.

