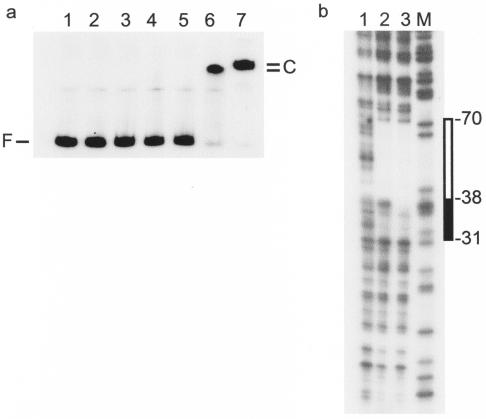
FIG. 5.
Interaction of SlyA with the hlyE promoter. (a) SlyA retards the mobility of PhlyE in band shift assays. SlyA concentrations: lane 1, 0 μM; lane 2, 0.06 μM; lane 3, 0.08 μM; lane 4, 0.1 μM; lane 5, 0.16 μM; lane 6, 0.31 μM; lane 7, 0.63 μM. The positions of the free DNA (F) and the SlyA-DNA complexes (C) are indicated. (b) DNase I footprint of SlyA at PhlyE. Lane 1, no protein; lane 2, 2.0 μM SlyA; lane 3, 4.0 μM SlyA; lane M, Maxam and Gilbert G track. The region of SlyA protection is indicated to the right (box). At the higher SlyA concentration, protection was extended, as indicated by the filled box.

