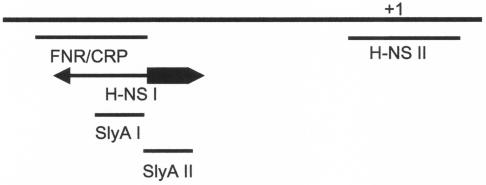
FIG. 6.
Schematic representation of the hlyE promoter region. The locations of the FNR/CRP box and SlyA sites are shown. The high-affinity H-NS binding regions observed in DNase I footprints of PhlyE are also shown. The transcript start site (+1) is marked. The region of the H-NS I site that extends downstream of the FNR/CRP box is indicated by a thick arrow, and the part overlapping the FNR/CRP box is indicated by a thin arrow.

