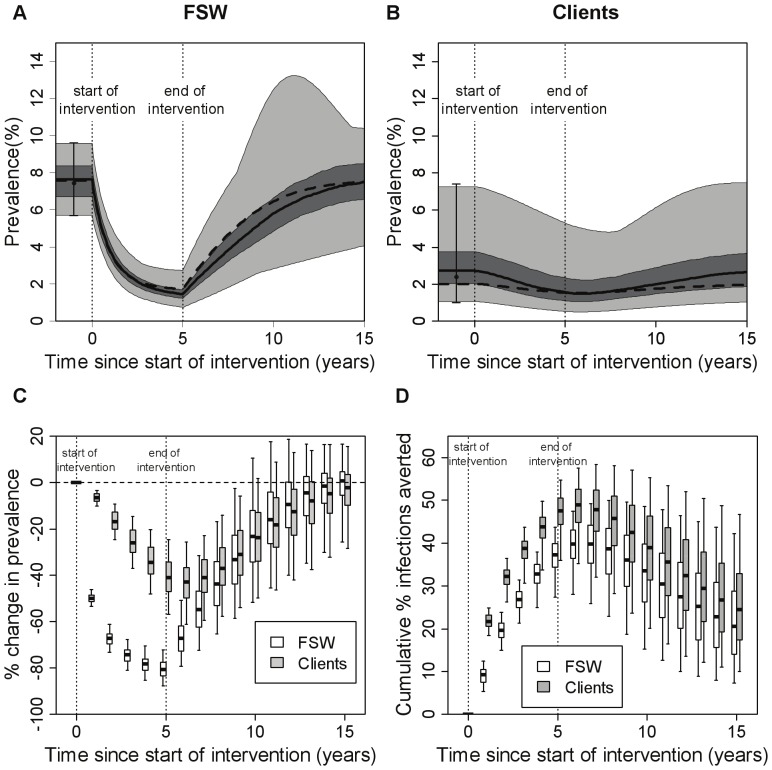
Figure 2. Projected intervention impact for the baseline model.
The baseline model is model 3, which has a heterogeneous FSW population, incoming syphilis infection and no regular partners. A test with sensitivity of 87% was used, with FSWs being tested on average once per year, and with immediate treatment of all individuals testing positive. Results are shown over 5 years of the intervention and for an additional 10 years after the intervention stopped. Panels (A) and (B) summarise the range of prevalences seen across the different fits (N = 326) for (A) FSWs and (B) clients. The thick solid line shows the median, the dark shaded area shows the interquartile range (25th–75th percentile), the light shaded area the full range (minimum-maximum), and the dashed line shows the best fit. The black circles with error bars represent the data (mean and range) that the model was fit to. In panels (C) and (D) impact is presented as (C) percentage change in prevalence (compared to pre-intervention endemic levels) and (D) percentage infections averted since the start of the intervention (compared with the situation where there was no intervention), and these are shown at yearly intervals. The thick horizontal line in each box is the median, with the box limits denoting the 25th and 75th percentiles and the whiskers denoting the 2.5th and 97.5th percentiles. The dotted vertical lines mark the start and end of the intervention.

