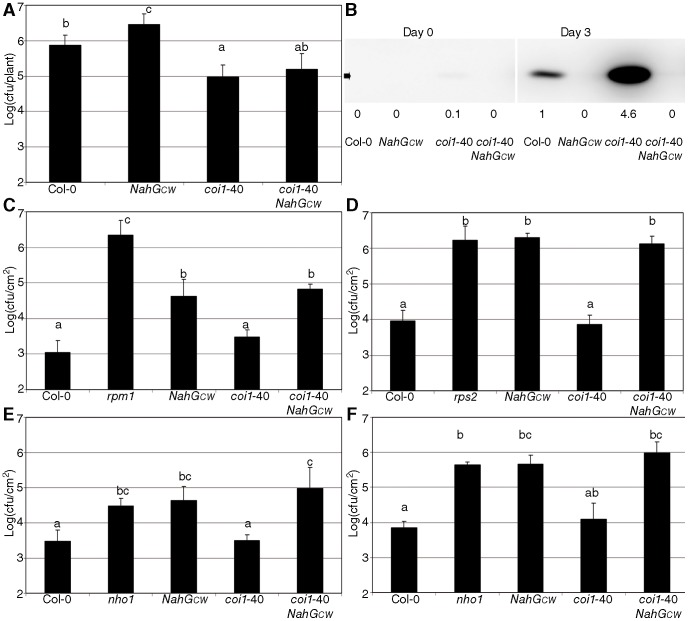
Figure 1. Characterization of resistance to biotrophs in coi1-40.
(A) Growth of Pto in the suppressor. Plants of the indicated genotypes were spray-inoculated with Pseudomonas syringae pv. tomato isolate DC3000 (Pto) at an OD600 of 0.1 when they were 18 days old. (B) PR1 Western blot of the indicated genotypes at day zero and three days post inoculation with Pto, inoculated as described in (A). The arrow indicates the position of PR1 (14 kDa). The same membrane was probed with anti-RuBisCO, as a loading and transferring control. The signal produced by anti-PR1 was quantified and normalized against the control of anti-RuBisCO. The data is shown in arbitrary units, where the amount in Col-0 inoculated with Pto is equal to one. (C) Growth of Pto(avrRpm1) in the suppressor. rpm1 is included as a control. (D) Growth of Pto(avrRpt2) in the suppressor. rps2 is added as a control. (E) Growth of Pseudomonas syringae pv. phaseolicola isolate NPS3121 in the suppressor. (F) Growth of Pseudomonas syringae pv. tabaci in the suppressor. In both (E) and (F) nho1 is used as a control. In the panels (C) to (F), 28 day-old plants were inoculated by hand infiltration with bacterial suspension at an OD600 of 2×10E-4, since it is the best way to characterize these resistances. The data represent the average and the standard deviation of three measurements, and in all the figures, the experiments were repeated three times with similar results. The letters above the bars indicate different homogeneous groups with statistically significant differences (Fisher's LSD Test, P<0.05).

