
Fig. 6.
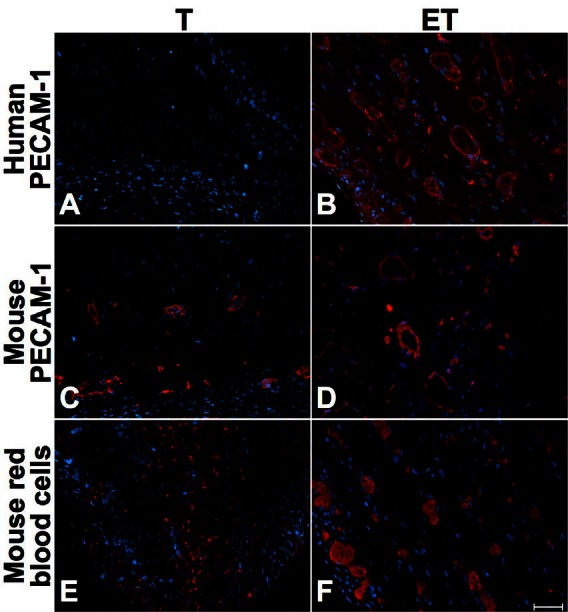
Long-term characterization (28 days after grafting) of T and ET models. Immunofluorescence of human PECAM-1 (A–B), mouse PECAM-1 (C–D) and mouse red blood cells (E–F) for T (left) and ET models (right column), at 28 days. Mouse red-blood cells were present all over both models, but in a greater proportion in the ET model. Antibodies are illustrated in red and nuclei in blue. Scale bar: 50 μm.