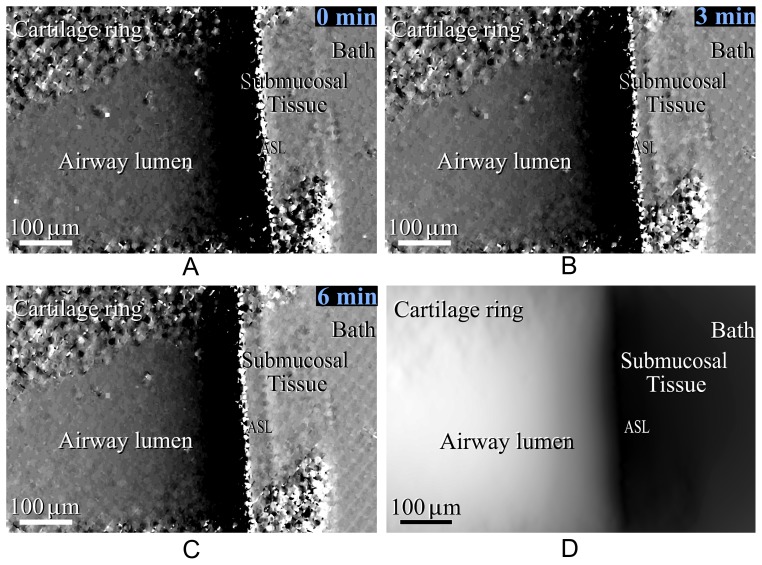
Figure 3.
Single-grid based image of the airway surface under hypertonic saline treatment, showing the sample thickness gradient in the x direction (the thickness gradient in the y direction is not shown as most features run vertically and do not provide y-contrast) a) before hypertonic saline treatment, b) 3 minutes after treatment, c) 6 minutes after treatment and d) the projected thickness calculated from image c).

