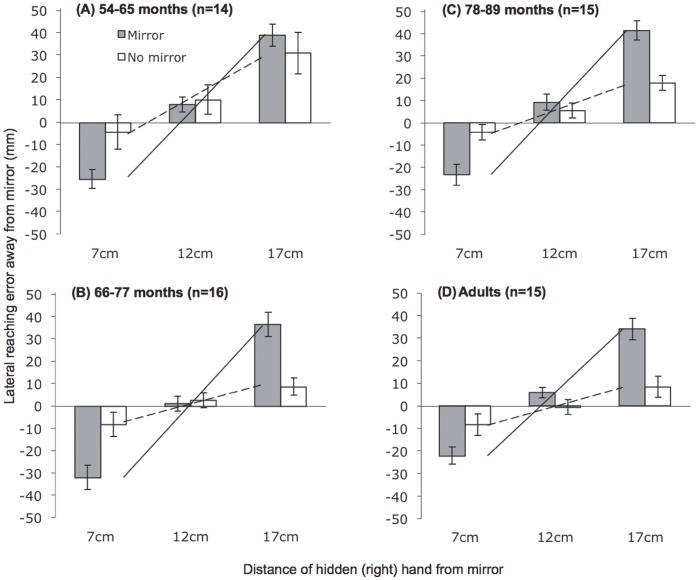
Figure 2. Mean reaching errors for each age-group across starting positions and mirror conditions.
Bars represent the errors within each condition (shaded bars = Mirror, unshaded bars = No mirror). The superimposed lines represent plots of the gradient of mean reach errors against starting position (solid line = Mirror, dashed line = No mirror).

