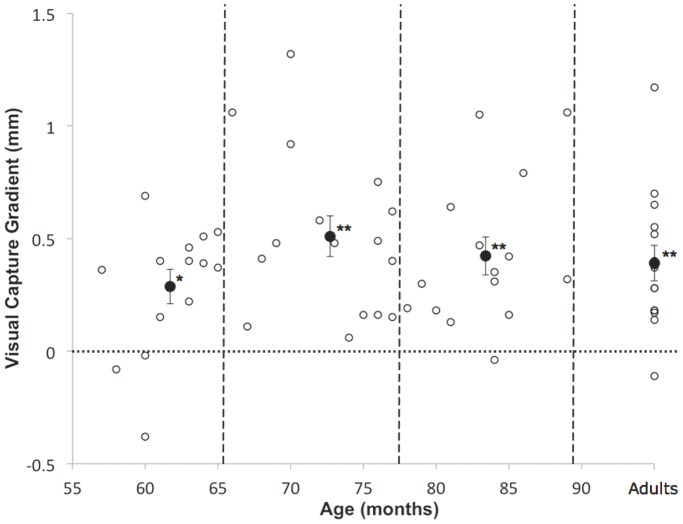
Figure 3. VCG scores plotted for each participant against age in months.
The visual capture score presented here is a difference of gradients. It is calculated by comparing the gradients of reach error (mm) against starting position (mm) in the Mirror and No Mirror conditions (error gradient in the “Mirror” condition - error gradient in the “No Mirror” condition). Open circles indicate individual participants’ visual capture gradient scores. Vertical dashed lines separate the age-groups compared in the analysis. Closed circles with standard error bars indicate the mean VCG scores for each age-group. Asterisks indicate group means which are reliably greater than chance (0) (* = p≤.01, ** = p.≤001).

