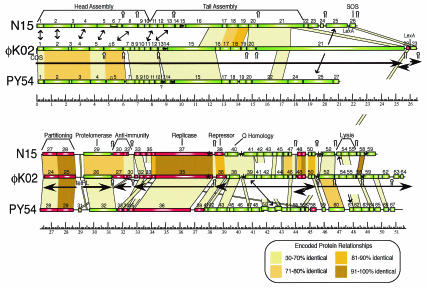
FIG. 2.
Map of the φKO2 genome. The genomes of phages φKO2, N15, and PY54 are shown with a scale of kilobase pairs for the φKO2 DNA. Predicted genes are indicated by rectangular boxes (those transcribed rightward are green and those transcribed leftward are red). Yellow and brown regions connect homologous regions of the two genomes. The predicted φKO2 transcription units are indicated below its genome. SOS refers to genes that may be involved in modulating and are controlled by the host SOS response. Double-headed arrows connect pairs of genes which have similarities to other genes of similar function but which have no discernible sequence similarity themselves. Asterisks denote putative φKO2 and N15 partitioning sites recognized by gene 27 and 28 proteins, and stem-loops denote predicted rho-independent transcription terminators (above the map for N15 and below the one for φKO2).

