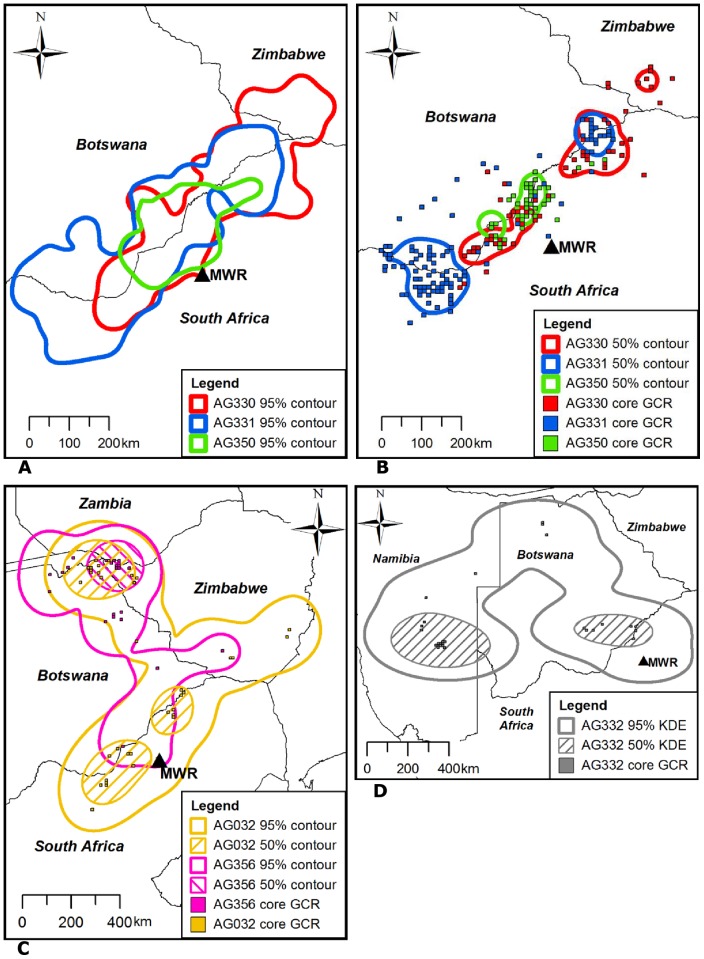
Figure 2. Overall and core foraging ranges for each individual.
95% KDE contours represent overall foraging ranges, 50% KDE contours and core GCRs represent core foraging ranges. (A) and (B) show the foraging ranges for AG330, AG331 and AG350; (C) shows the foraging ranges for AG032 and AG356; (D) shows the foraging ranges for AG332. Mankwe Wildlife Reserve capture site is indicated by a black triangle and “MWR”.

